
Running the Stress Test
Running a stress test by playing a previously recorded session simulates a real-time multi-user environment. After you have one or more recorded sessions you can proceed with the stress test procedure.
The Stress Test Tool plays back a session by sending sequences of recorded Ajax requests to the server. These Ajax requests simulate many users interacting with the web application. Note: playback does not run your web application in a real browser window — the simulation consists of sending recorded Ajax packets to the server in the exact order they were recorded.
Prepare the environment
Do not run the Stress Test Tool in the IDE or in debug mode. Running in debug mode will greatly reduce the tool's speed and performance. Compile and run the executable directly.
To record and playback a mobile session, explicitly add '/m' to the end of the application URL.
Load a saved project or record a new session if there are no recorded sessions available.
Adjust test parameters
Adjust these settings before starting the test:
Total sessions per run: number of sessions created in each run. Start low and increase gradually. Should be less than or equal to ServerModule->ServerLimits->MaxSessions.
Max Worker Threads: number of worker threads used to communicate with the server. Should be less than or equal to ServerModule->ServerLimits->MaxRequests.
Total number of runs: how many times to play the recorded session.
Delay between runs: seconds to wait before a new run starts.
Playback Speed: adjust the simulated session speed. "Max Speed" inserts no delay between Ajax calls; "Real Time" tries to match the original recorded timing.


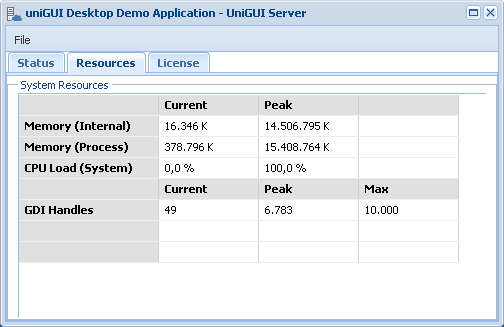
Server monitor metrics
Sessions: number of sessions currently running. Peak value shows the maximum concurrent sessions during the server lifetime.
Requests: number of pending Ajax requests currently being processed by the server.
Purged Files/Folders: files/folders no longer belonging to sessions but not yet erased. The framework deletes purged files/folders in a background thread; under normal conditions this value should eventually become zero.
Bytes: number of bytes sent/received during the server lifetime.
Uptime: time passed since the server started.
Memory: total amount of memory the server application is consuming. This is critical to monitor:
32-bit apps: although theoretical limit is 2 GB, in practice values above ~1.0–1.1 GB are dangerous due to fragmentation and memory manager limitations. "Out of Memory" messages may be logged and users may see warnings when starting new sessions — this can lead to unpredictable results and crashes.
64-bit servers are much less likely to hit Out of Memory; Windows can use virtual memory (swap) when physical RAM is exhausted, though performance will degrade.
Memory (Internal/Process): "Internal" is memory used by the uniGUI app itself. "Process" is total Windows process memory (which may include memory used by external DLLs or if running as an ISAPI DLL, the ISAPI worker process).
CPU Load: shows total CPU usage across cores. An idle uniGUI server plus OS should typically not exceed ~1% CPU usage.
GDI Handles: limited system resource tracked by the OS. uniGUI is optimized to keep GDI handle usage low; a typical idle uniGUI app should not consume more than ~100 GDI handles even with many active sessions. A constant increase in GDI handles indicates leaks or overuse. Running out of GDI handles will log EOutOfResources exceptions and can lead to server crash.
Log files
Monitor web application log files during the stress test. Stress test runs in the background without GUI output; the log file is the primary way to verify app behavior and detect errors. Logs are located under the .\logs folder next to your application's binaries; there is a separate log file per calendar day. Open the log in a text viewer/editor to check for unexpected entries such as Access Violations or other exceptions. For more detailed debugging, consider tools like EurekaLog.
Where to look for logs
Log folder: .\logs (next to application binaries)
One log file per day — inspect for Access Violations, Exceptions, or other errors recorded during runs.
Important: Each stress test runs the same recorded session simultaneously multiple times for the same URL. While testing, set ServerModule->SessionRestrict to srNone.